Families of Functions
Skateboard
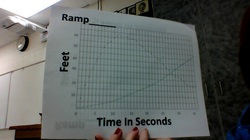 21 inch ramp
A. My prediction was nowhere near accurate due to me drawing the graph upside-down. The initial reason my graph was different is because I had read the scale or the graph incorrectly.
B. Domain: (0,35) Range: (0,60)
C. Each graph starts at zero, they each have a minimum of (0,0), the 21 inch ramp has a maximum at (12,60)
D. The graph rises the fastest when the skateboard travels down the ramp, while it travels the slowest when the slope of the driveway forces it backwards.
B. Domain: (0,35) Range: (0,60)
C. Each graph starts at zero, they each have a minimum of (0,0), the 21 inch ramp has a maximum at (12,60)
D. The graph rises the fastest when the skateboard travels down the ramp, while it travels the slowest when the slope of the driveway forces it backwards.
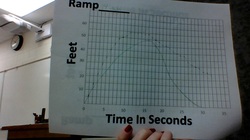 14 inch ramp
A. My prediction was close to the actual graph.
B. Domain: (0,35) Range: (0,60)
C. Each graph starts at zero, they each have a minimum of (0,0), the 14 inch ramp has a maximum at (11,54)
D. The graph rises the fastest when the skateboard travels down the ramp, it travels the slowest when the slope of the driveway forces it backwards and it slowly loses momentum and stops.
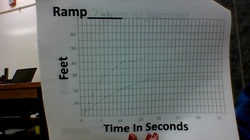 7 inch ramp
A. My prediction was close to the actual graph.
B. Domain: (0,35) Range: (0,60)
C. Each graph starts at zero, they each have a minimum of (0,0), the 7 inch ramp has a maximum at (14,42)
D. The graph rises fastest when the skateboard travels down the ramp.
B. Domain: (0,35) Range: (0,60)
C. Each graph starts at zero, they each have a minimum of (0,0), the 7 inch ramp has a maximum at (14,42)
D. The graph rises fastest when the skateboard travels down the ramp.
Inverse Functions Activity
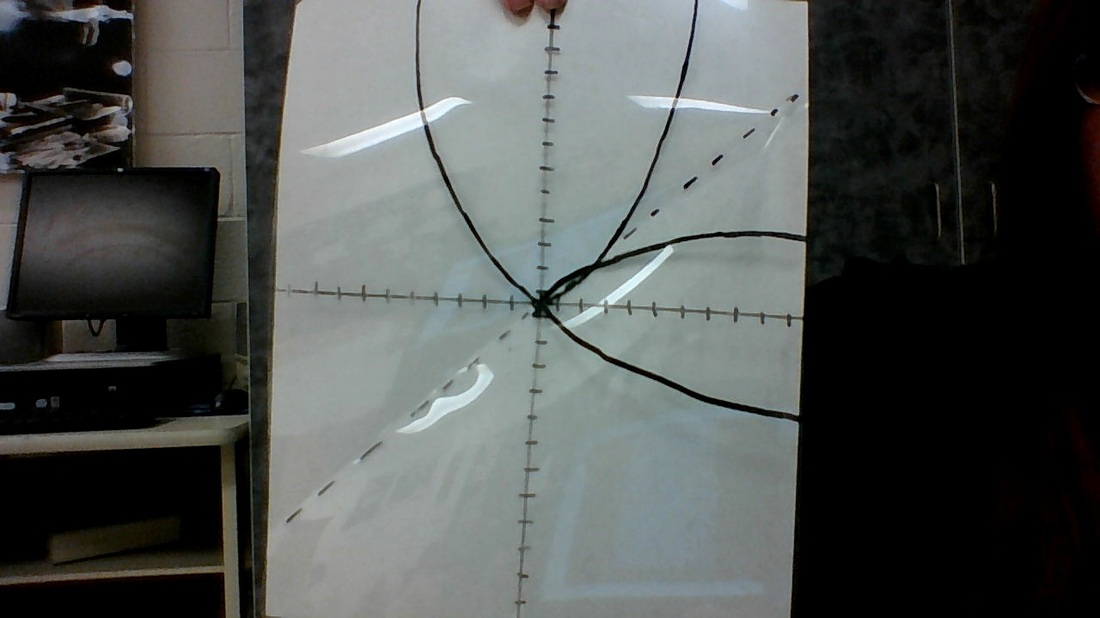
I found the inverse of y=x^2 by giving the ^2 to the y value. x=y^2, I took the square root of both side of that equation, and then I graphed x=y and -x=y.
I also drew a dotted line across y=x and folded along that line, if I would have been more accurate the function and it's inverse would have lined up. |
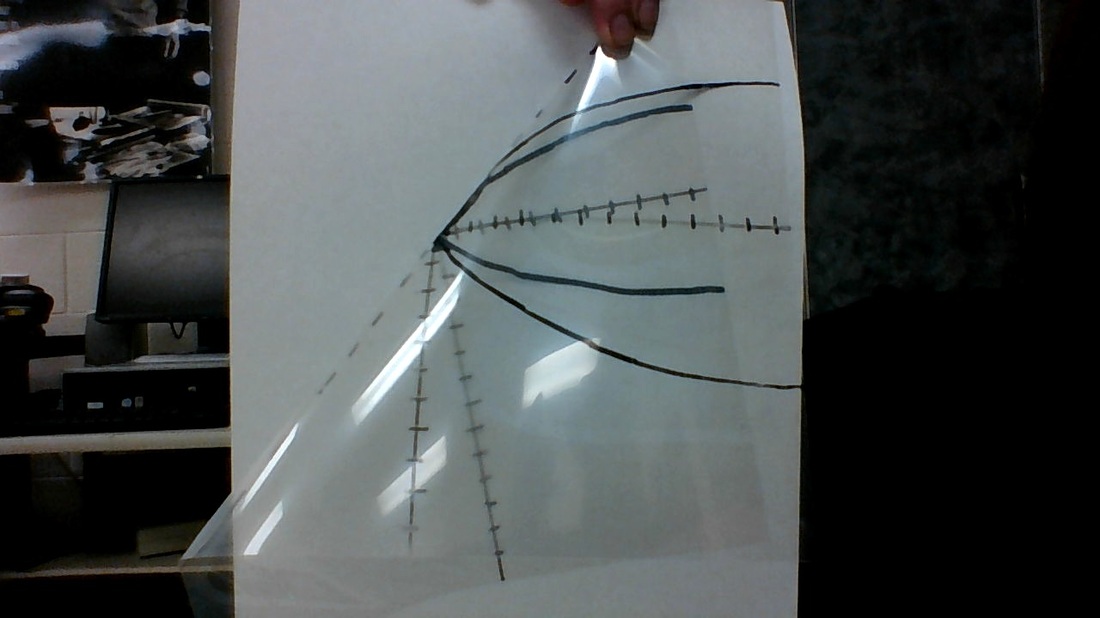
Although this function does not have an inverse that is also a function, there are other functions that can have an inverse as a function.
|
Piecewise Functions
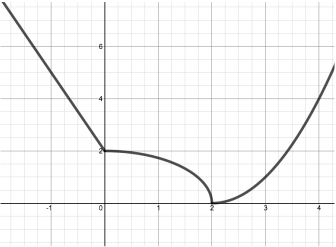
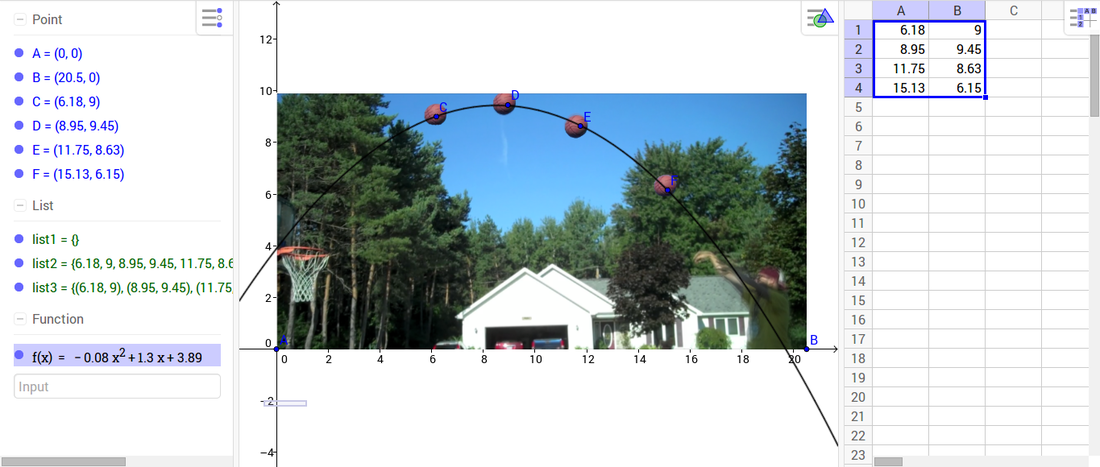
No, the ball will not make it into the hoop.
Connecting Zeros and Factors
Folding to the Moon

1. In order for a stack of paper to reach the moon it would have to be folded 41 times.
2.This is very unrealistic because a regular sheet can only be folded 7 times.
3.The stack of paper would be approximately 15 billion inches wide, if it were possible to fold paper 41 times.
2.This is very unrealistic because a regular sheet can only be folded 7 times.
3.The stack of paper would be approximately 15 billion inches wide, if it were possible to fold paper 41 times.
How To Use a Unit Circle
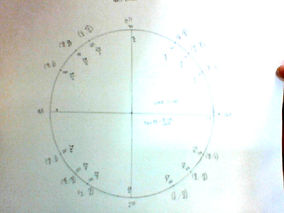
- (cosθ, sinθ) cosθ is the y value and sinθ is the x.
- tanθ=sinθ/cosθ
Arduino Sine Wave
float sinVal;
int toneVal;
int k=0;
void setup () {
pinMide(8,OUTPUT);
}
void loop () {
while (k<2000){
for (int x=0;x<180;x++) {
sinVal = (sin(x*(3.1412/180)));
toneVal=2000+(int(sinVal*1000));
tone(8.toneVal);
k++;
delay(2);
}}
for (int x=0;x<180;x++) {
sinVal = (sin(x*(3.1412/180)));
toneVal=2000+(int(sinVal*1000));
tone(8,toneVal);
delay (5); }
}
To change the tone of the siren, we changed the 180 in the sinVal. To make it loop the code and make it change every five seconds, we set delay to five.
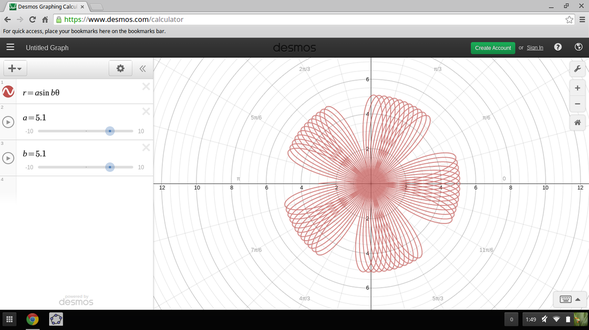
To make these graphs I used desmos. I used the equation of r=a+bcostheta where "a" and "b" are both sliders.
